FEATURED SCREENS
What shipped
01
02
03
04
05
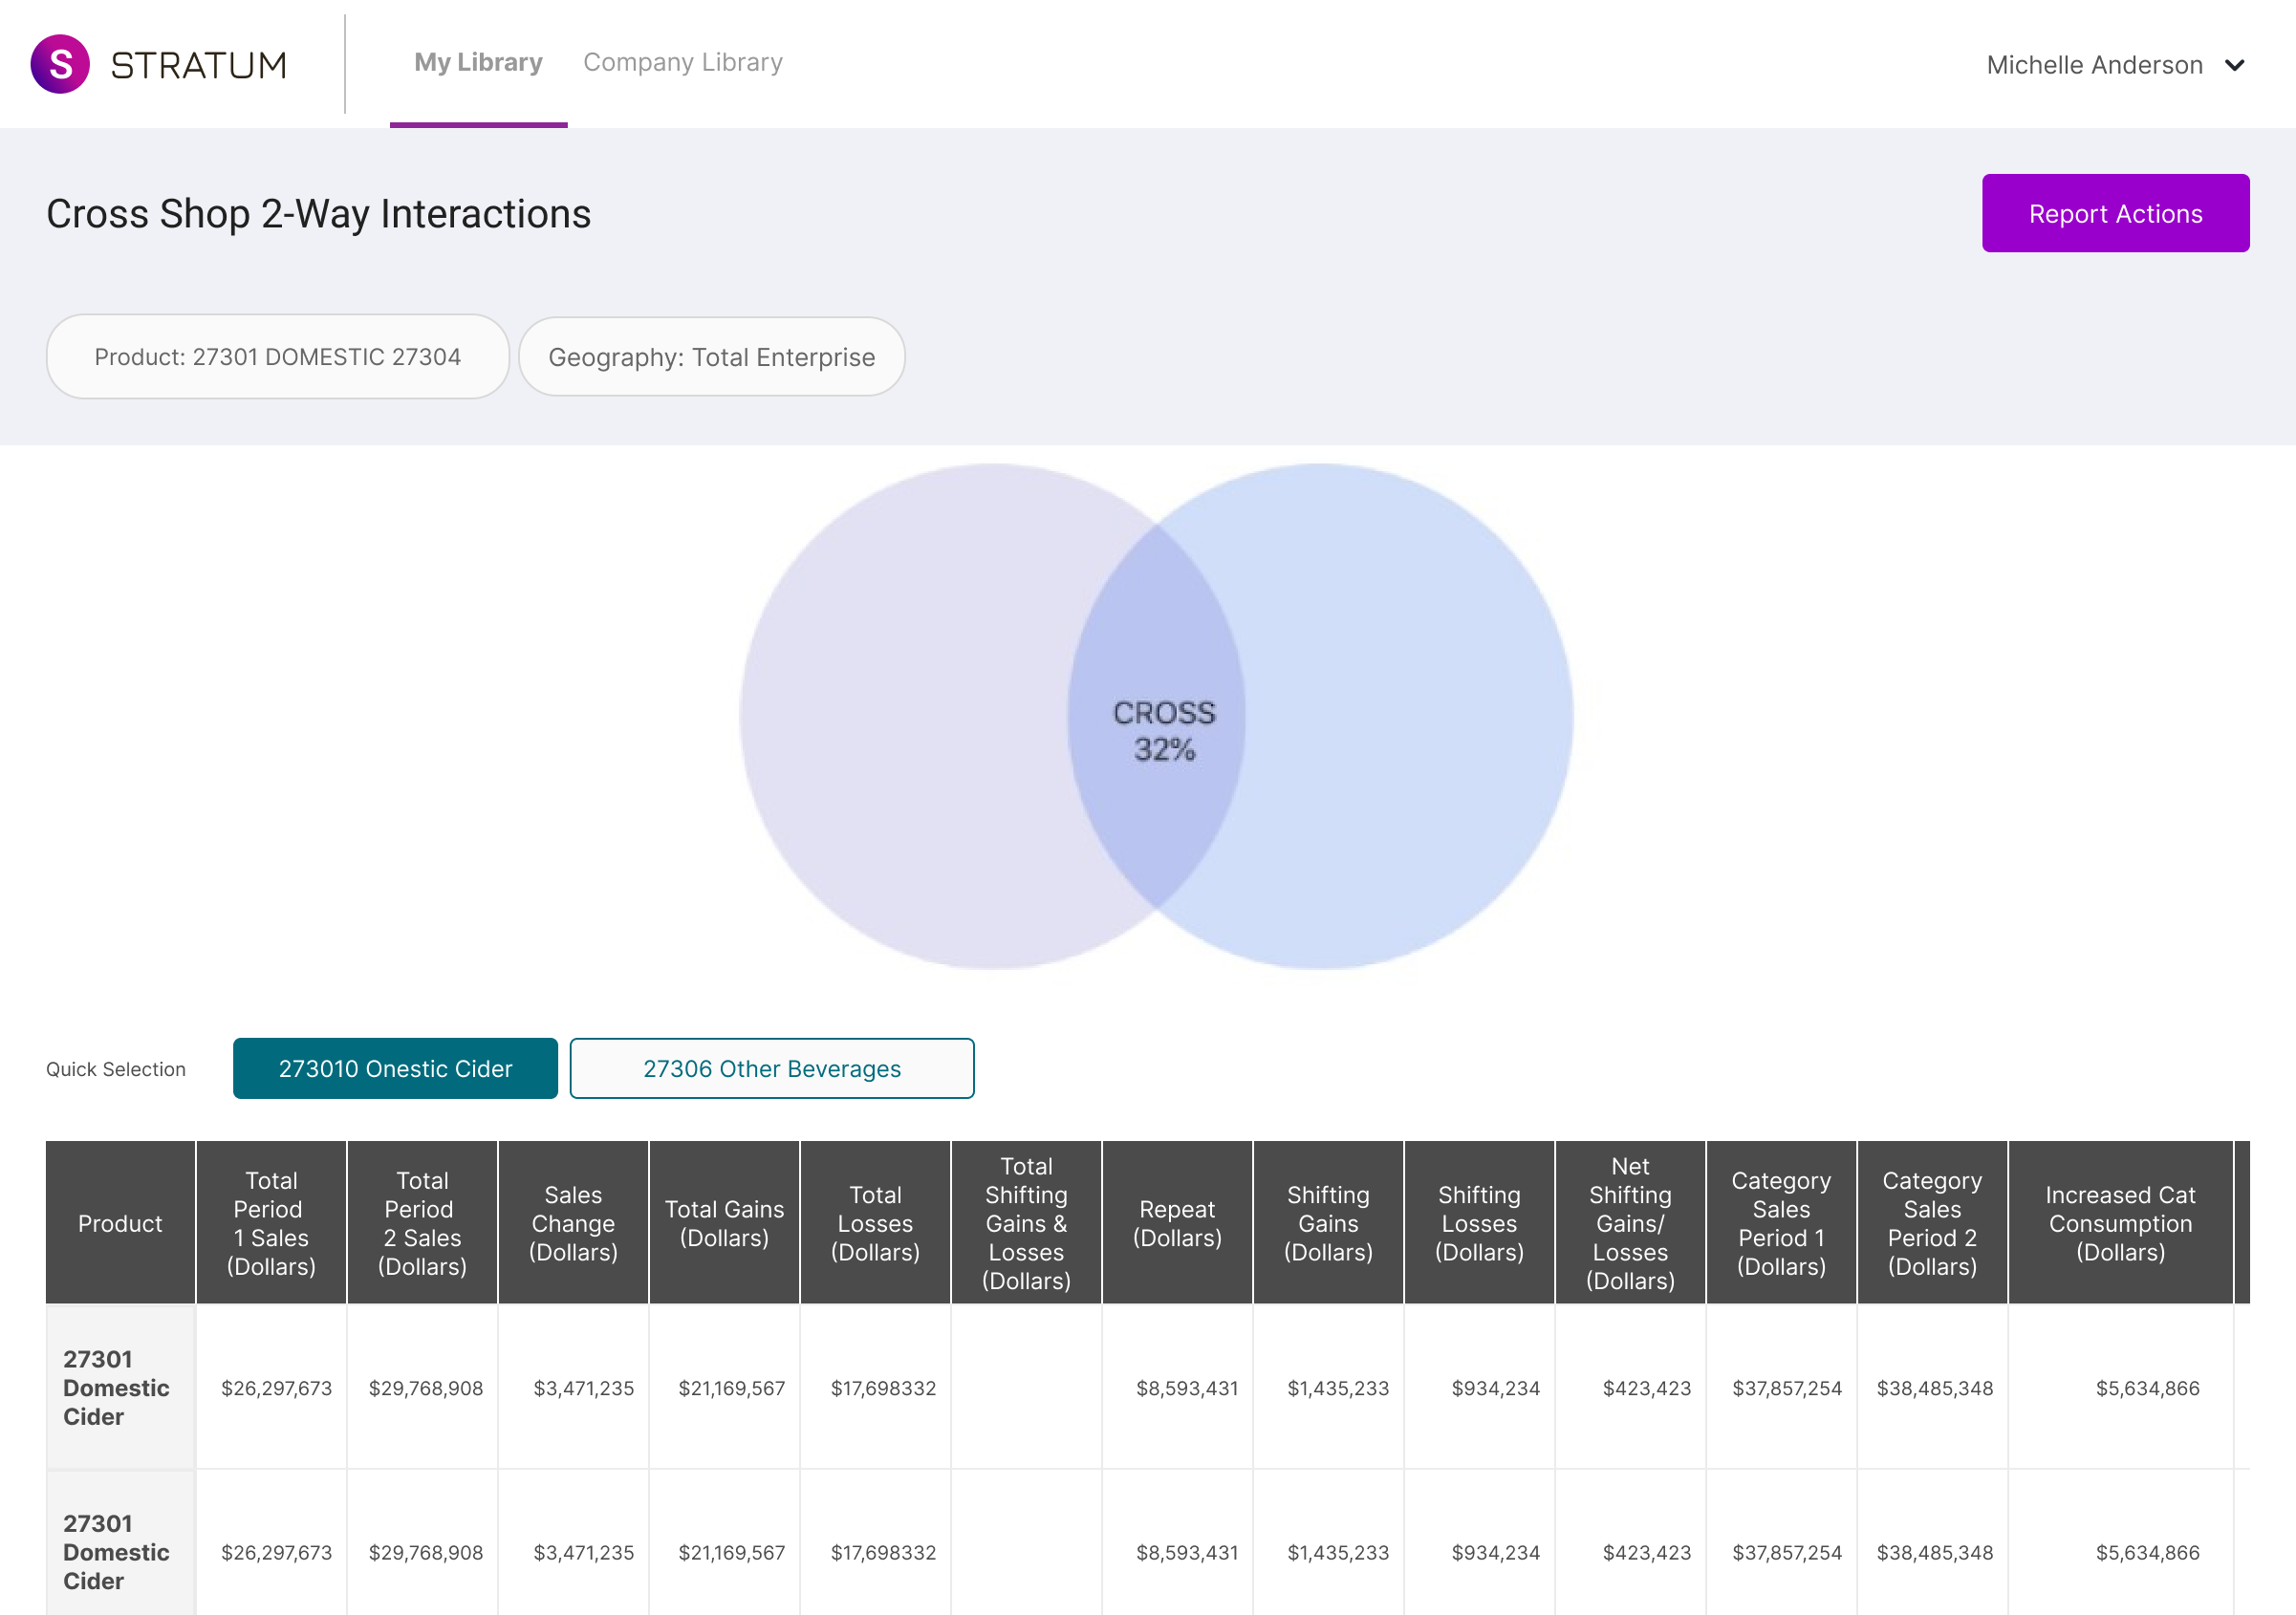
A grocery data analytics company needed to replace three slow, disconnected legacy tools with a single platform used by thousands of merchandisers, distributors, and analysts. I joined as an embedded ThoughtWorks consultant alongside my design manager. My first job was to get a stalled design process moving again, and from there I led the design decisions that shaped a clearer, more usable product. At launch, the platform supported an existing base of 1,500 clients and more than $140M in annualized revenue, and NPS rose by 72 points.
84.51° is Kroger's data science company. It helps retailers and consumer goods brands turn grocery purchase data into an understanding of their customers and markets.
The tools people relied on were slow and unforgiving. A report could take five minutes or more to generate, and a single mistake meant starting over. Each of the three tools kept its data to itself, so anyone who needed a fuller picture exported everything to spreadsheets and built their own pivot tables by hand. When a report didn't exist anywhere, people simply built it outside the system.
Beneath all of this sat a tension I returned to throughout the project. The product had to offer depth and flexibility to power users building highly custom views, and it had to feel quick and simple to someone who needed a clean snapshot for a leadership meeting in ten minutes. Nearly every decision I made, especially around report layout, came down to serving both people well rather than choosing one over the other.
Until the design bottleneck was resolved, nothing else was going to ship.
Sharing a city with Kroger's merchandisers made frequent, in-person testing possible.
The Rows and Columns structure made every report easier to approach, and it was one of the clearest contributors to the improvement in NPS.
A single, consistent way of working replaced the habits of three separate tools.